

Kinsale Capital Group - Insuring what others won’t
How a Richmond insurer built a technology moat inside one of the least glamorous corners of American finance, and what the growth slowdown actually means


The business
Most insurance companies compete for the same pool of predictable risks: the office building with a clean loss history, the manufacturer with standard liability exposure, the homeowner in a low-flood zone. They compete on price, distribute through agents, and earn margins that reflect the commoditised nature of what they are selling.
Kinsale Capital does none of that.
The company operates exclusively in the Excess and Surplus lines market, a corner of the US insurance industry that handles what the standard market refuses. The restaurant with a prior fire claim. The cannabis dispensary. The construction firm working in a catastrophe zone. The life sciences startup with product liability exposure nobody has priced before. Risks that are unusual, complex or elevated get declined by admitted carriers and sent to the E&S market, where insurers operate without state-mandated rate and form filings. That regulatory freedom is the structural gift: E&S carriers can price risk as they see it, not as a regulator permits.
The E&S market in the United States was approximately $135 billion in premium volume in 2024, growing at 12.5% that year. It has grown faster than the admitted market for most of the past decade, driven by increasing risk complexity, climate exposure, and an expanding universe of novel business categories that standard underwriters decline to model. Kinsale’s share of that market is approximately 1.4%.
The company was founded in 2009 by Michael Kehoe, who had spent the prior fifteen years running E&S businesses at James River Insurance and Colony Insurance. It went public in 2016 at $16 per share. Revenue comes from underwriting income (the spread between premiums earned and losses plus expenses paid) and investment income earned on the float. In FY2025, investment income reached $192.2 million, up 27.9% from the prior year. It now represents approximately 38% of total net income.
What makes this business tick: The moat
The E&S market is not inherently a high-return business. Scale alone does not create advantage: the largest E&S carriers do not post combined ratios anywhere near Kinsale’s. The moat here is specific, not structural to the market.
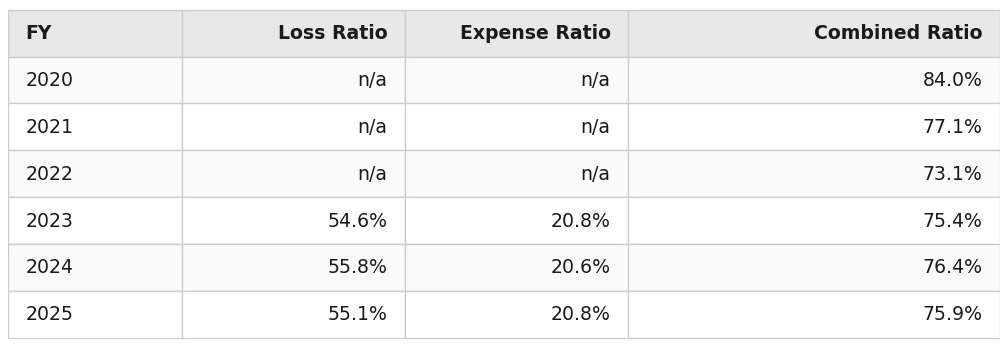
The Expense Ratio Advantage
The single most important number in Kinsale’s financial history is the expense ratio.
In FY2025, Kinsale’s expense ratio was 20.8%. The specialty insurance peer average sits in the mid-30s. That gap -- roughly 13-15 percentage points -- is permanent and compounding. On $1.6 billion of net written premiums in FY2025, it represents approximately $200 million of additional underwriting profit per year relative to a peer operating at average efficiency.
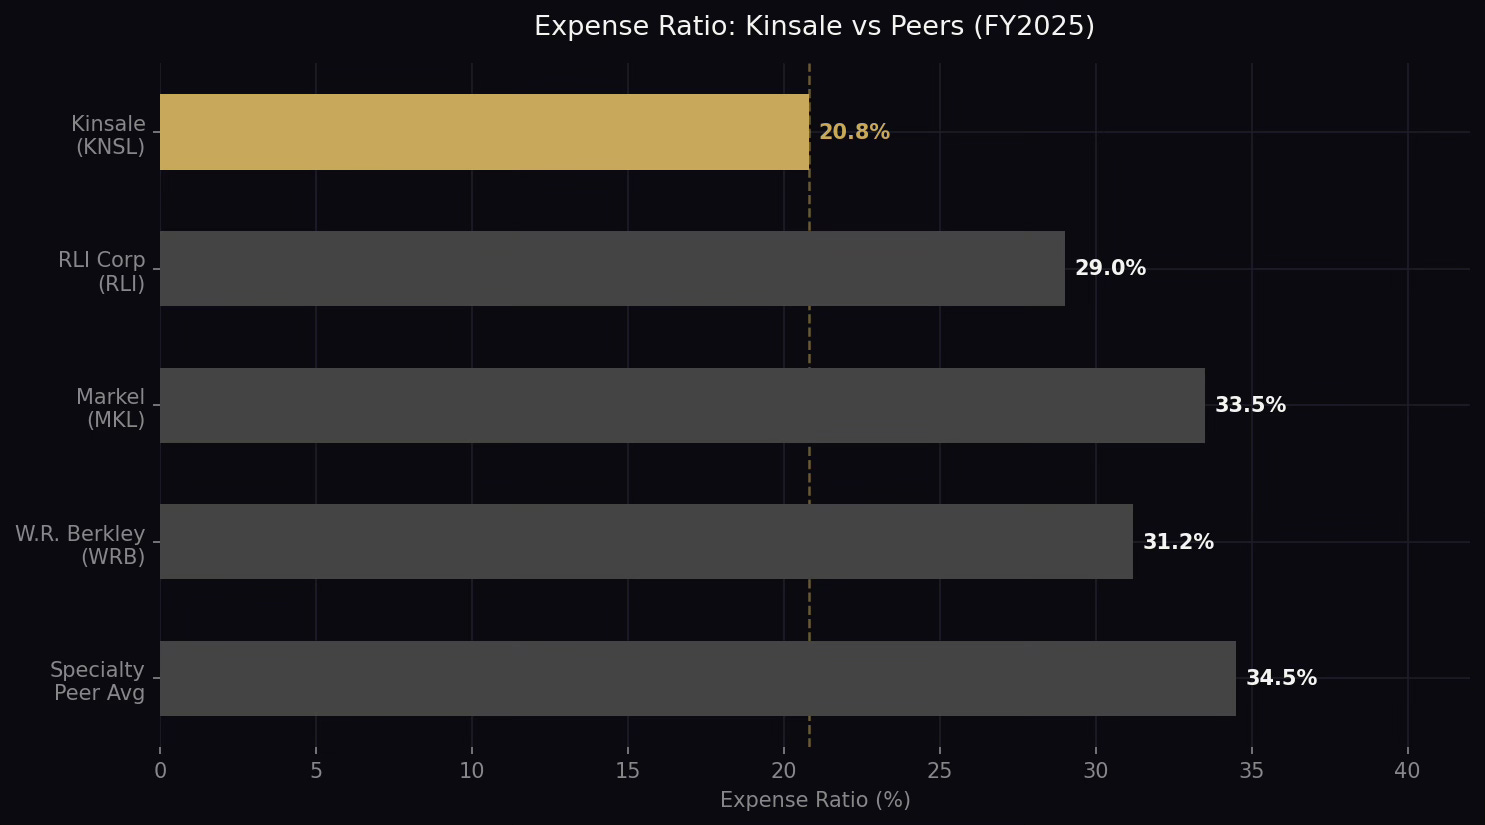
Chart 1: Kinsale expense ratio vs specialty insurance peers FY2025. Gap to average: approximately 14 percentage points.
The advantage comes from a proprietary technology platform that Kehoe built from the ground up, starting before the company had meaningful premium volume. Three specific mechanisms explain the expense ratio gap. First, underwriting speed and triage: routine small commercial submissions below a certain premium threshold are auto-processed, providing pricing outputs without requiring senior underwriter time. Each underwriter handles significantly more submissions per year than at a competitor relying on manual workflows. Second, loss data feedback loops: the data warehouse captures fifteen years of claim outcomes by risk type, geography and coverage line. This calibration enables Kinsale to identify which E&S segments are underpriced relative to actual loss experience -- and walk away -- or overpriced relative to peers -- and compete aggressively. A new E&S entrant has zero of this historical calibration. Third, claims integration: the same platform handles claims investigation and reporting alongside underwriting, eliminating the coordination overhead between departments that inflates costs at larger, siloed organisations.
This is not the kind of advantage a competitor can close by hiring a technology team. The data that trains Kinsale’s pricing models is fifteen years of proprietary E&S risk outcomes. The platform and the data are the same thing.
The Loss Ratio Discipline
Kinsale’s loss ratio in FY2025 was 55.1%, improved from 55.8% in FY2024. The company does not chase volume at the expense of underwriting quality. When the E&S market softens and competitors lower their standards to retain premium, Kinsale has historically been willing to let business walk. This is not a virtue in the abstract; it is a product of the fact that management’s incentives are aligned with long-term underwriting performance. Kehoe owns approximately 9.15% of the company.
The Float Machine
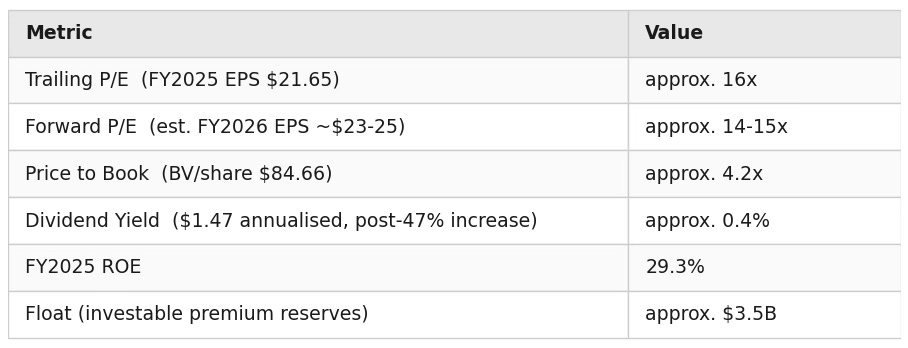
As the premium base has grown from $552 million in 2020 to $1.98 billion in FY2025, Kinsale’s investable float has grown proportionally. The float now stands at approximately $3.5 billion (unpaid losses and unearned premiums). Underwriting profitably, accumulating float, investing float at no cost of capital: this is the same flywheel that defines Berkshire Hathaway’s insurance operation.
Five-Year Financial Performance
The five-year record is exceptional. FY2025 adds a new chapter: growth decelerated sharply, but the earnings quality held.
Gross written premiums
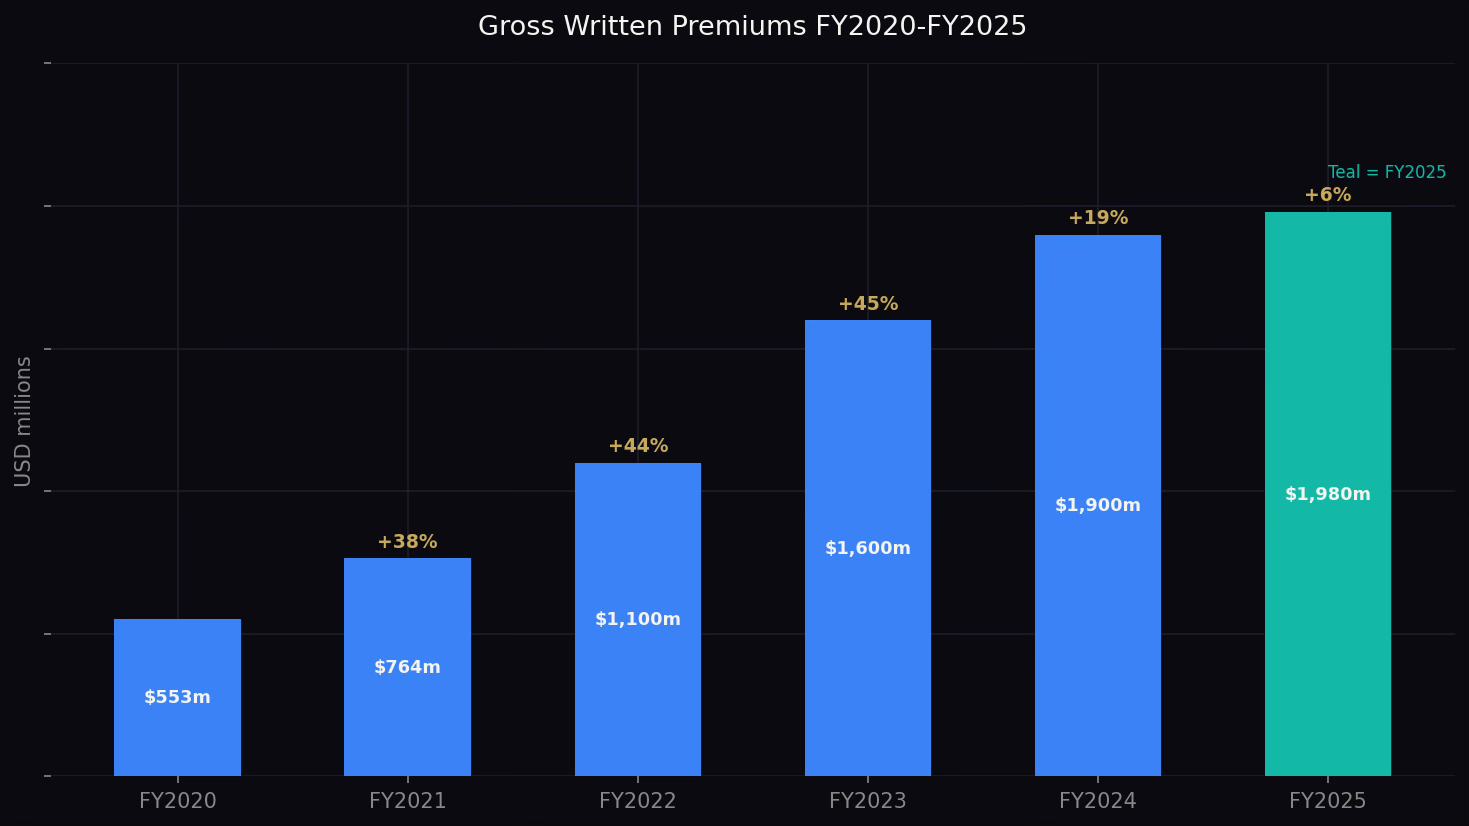
Chart 2: GWP FY2020-FY2025. Five-year CAGR approximately 29%. Teal bar = FY2025
It is worth being precise about what the slowdown does and does not mean. GWP growth measures how fast new premium is being written. Earnings quality is a separate question: it depends on the combined ratio, the expense leverage, and the investment income the float generates. In FY2025, GWP grew 5.7% and EPS grew 21.7%. Those two numbers in the same year are the most important data point in the article. The earnings machine does not depend on a hard market to function. A business whose EPS grew 21.7% in its slowest premium growth year is not a business that is weakening. It is a business whose earnings are becoming more diversified.
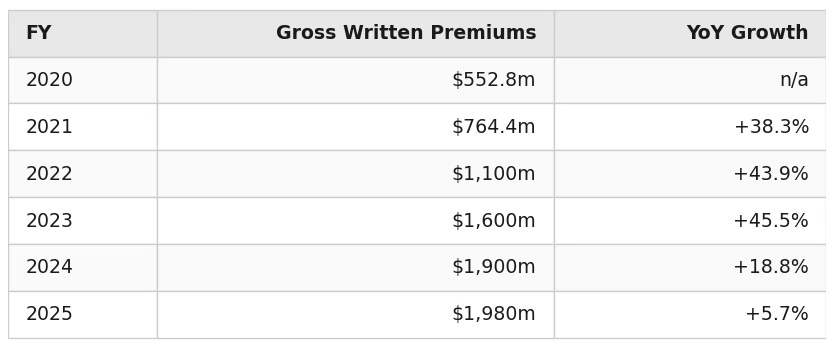
Combined ratio
Chart 3: Combined ratio trend FY2020-FY2025. White band shows approximate industry average. Breakeven = 100%.
A combined ratio below 100% means the underwriting operation is profitable before investment income. Below 90% is considered excellent in the industry. Kinsale has not exceeded 84% in any year on record.
Net Income and EPS
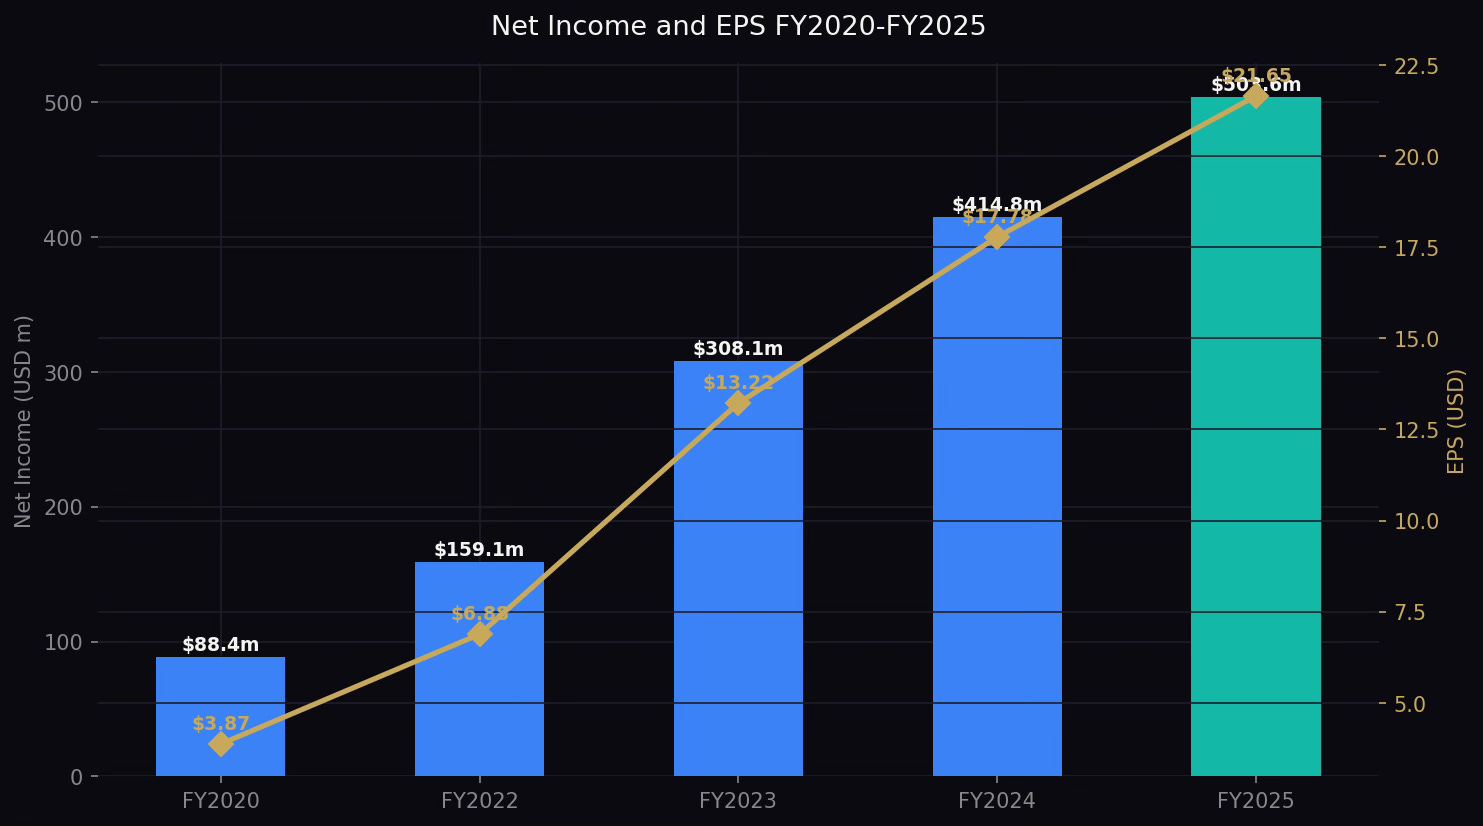
Chart 4: Net income (bars) and diluted EPS (gold line) FY2020-FY2025.
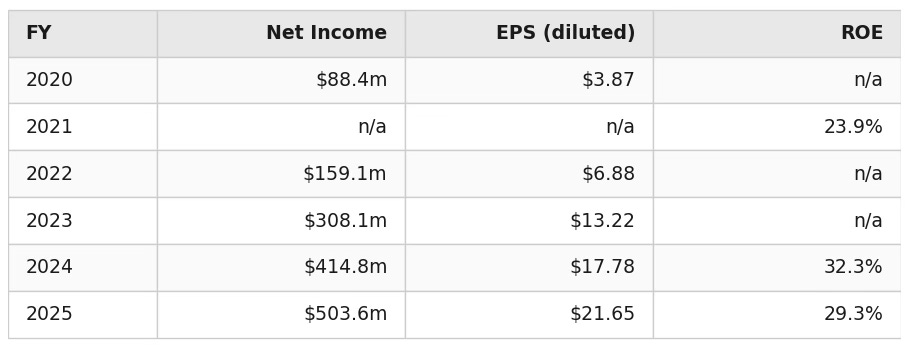
EPS grew 5.6x from 2020 to 2025, including +21.7% in FY2025 alone. ROE of 29.3% in FY2025 compares to a specialty insurance industry average of 15-20%.
Q4 2025 and Full-Year Summary
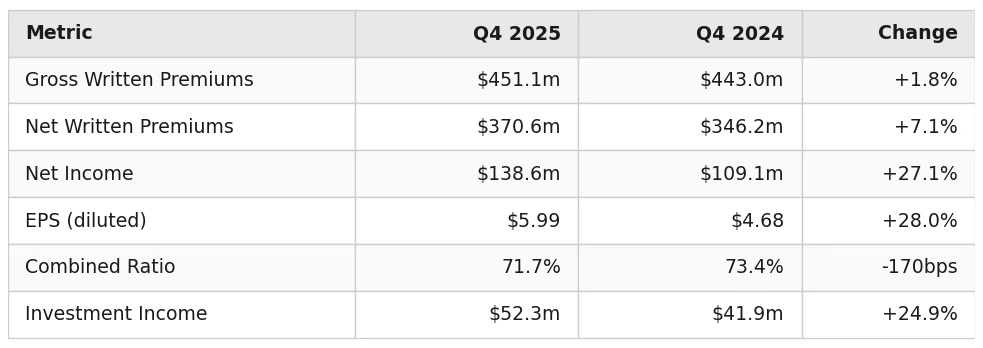
Q4 2025 was Kinsale’s strongest quarter of the year: combined ratio of 71.7%, net income +27.1%, EPS $5.99. The full-year FY2025 picture is one of growth deceleration (+5.7% GWP) offset by exceptional underwriting quality (combined ratio 75.9%) and a fast-compounding investment income stream ($192.2m). Q1 2026 results are due April 23, 2026.
The full-year 2025 soft market is now documented. The key forward question: does GWP growth recover toward management’s stated 10-20% cycle target in 2026? Analyst consensus for FY2026 projects approximately 13% GWP growth. April 23 is the first data point.
Capital allocation
Kinsale carries $200 million of senior notes, a conservative debt load for a business with $2.0 billion in equity. The debt-to-equity ratio of approximately 0.11 is among the lowest in its peer group. The investment portfolio is conservatively positioned in fixed income, consistent with preserving the float while generating steady income.
Capital returns to shareholders accelerated in FY2025. Kinsale raised its quarterly dividend by 47% and authorised a new $250 million buyback programme after exhausting the previous $100 million facility.
The rationale is straightforward: at 29% ROE, every dollar retained and deployed into new premium business generates twenty-nine cents of annual return. Paying that dollar out as a dividend and having the shareholder reinvest it in a 5% bond is a destruction of economic value. The right answer is to compound internally for as long as the returns remain this high.
Growth drivers
1. E&S market structural growth
The E&S market has grown faster than the admitted market for most of the past decade, and the structural drivers remain intact. Climate change is expanding the category of risks that admitted carriers decline. New business models (cannabis, rideshare, gig economy, AI liability) create novel risk exposures that standard insurers lack the data to price. Economic complexity and litigation frequency push more commercial risks into the non-standard category. The market growing at double-digit rates is not a cycle; it is a structural shift.
2. Market share within E&S
Kinsale’s 1.4% share of a $135 billion market leaves substantial room for growth at current size. The company’s competitive positioning within E&S is improving, not deteriorating: its expense advantage means it can profitably write business at rates that peers cannot match without losing money.
3. Investment income flywheel
The float grows with the premium base. Even if premium growth normalises to 15-20%, the float continues to expand, generating incremental investment income. At current interest rates, $3.0 billion of float generates approximately $150 million per year. If the premium base reaches $3 billion, the float-derived income stream becomes a material component of total earnings independent of underwriting results.
4. Property lines expansion
Property represents 29.3% of GWP in FY2025 (casualty 70.7%), having faced headwinds in the second half of 2025 as admitted carriers returned capacity. The E&S property market has been particularly hard-priced as admitted carriers pull back from catastrophe-exposed regions. Kinsale’s expansion into property is disciplined -- Kehoe has been explicit that the company will not sacrifice underwriting quality for growth -- but it represents a meaningful incremental driver for the next three to five years.
5. Casualty deepening
Kinsale’s 70.7% casualty concentration continues to compound on a growing base. Small business, allied health, life sciences, environmental and specialty casualty lines all represent verticals where Kinsale’s technology platform provides systematic pricing advantages.
Risks
The risk profile of Kinsale is different from a typical growth company. The business generates cash, has conservative leverage, and has demonstrated underwriting discipline through multiple market cycles. The risks cluster in a specific way: the biggest threats are cyclical and competitive, not operational.
The underwriting cycle: How E&S markets work
The underwriting cycle is the structural force that shapes every E&S insurer’s growth trajectory. In hard markets -- following catastrophic losses or capital withdrawal -- pricing rises, capacity tightens and more risks migrate from the admitted market into E&S. Kinsale’s growth years of 40-45% (2021-2023) coincided with one of the hardest E&S markets in recent history. In soft markets, the opposite: new capital and competing MGAs enter, pricing softens, and risks that flowed into E&S flow back to admitted carriers. FY2025 is a soft market year. Kinsale’s response, holding pricing and ceding volume, is correct long-term. The risk is not that the response is wrong, but that the soft cycle extends longer than the consensus expects. Soft cycles in E&S have historically lasted 24-36 months. If FY2025 is year one, FY2026 may still be soft.
The growth deceleration: Cycle or structure?
This is the central question and it deserves directness. GWP growing 5.7% in FY2025 after a 35% CAGR through 2023 is a confirmed deceleration. The full year is now documented, not a single quarter. Two explanations exist, and both may be true simultaneously.
The first is cyclical: the E&S market is softening as more capacity enters. When admitted carriers and reinsurers add capacity after a hard market, risks that flowed into E&S during the hard period flow back to the admitted market at lower rates. Kinsale’s response in prior soft markets has been to hold underwriting standards and cede volume. If this is the dynamic, the growth slowdown is temporary and the combined ratio remains pristine.
The second is structural: as Kinsale grows from $500 million to $2 billion in premiums, the law of large numbers constrains percentage growth. The business may be maturing faster than the bull case assumed. Investors should hold both explanations and watch the next two or three quarters before reaching a firm conclusion.
Catastrophe exposure
FY2025 catastrophe losses totalled 1.9 points of the combined ratio (primarily the Palisades Fire), manageable at the full-year level. But as the property book has grown toward 30% of GWP, catastrophe volatility is a structural feature of results, not an exceptional event. It is not an existential risk, but it introduces earnings noise that the market has historically discounted in the multiple.
Valuation still requires growth
At 16x trailing FY2025 earnings and 4.1x book, Kinsale is at its cheapest since the early post-IPO years. That is attractive for the quality of the business; it is not a deep discount that cushions against further disappointment. If FY2026 GWP growth again comes in below 10% and the combined ratio drifts toward 80%, further multiple compression is possible. The stock is materially cheaper than it was; it is not cheap enough to own without a thesis on when growth recovers.
Key person concentration
Michael Kehoe is 58 years old and has built Kinsale’s culture and underwriting philosophy over fifteen years. The company is more institutionally deep than at IPO, but the founder-CEO dynamic is still a meaningful concentration of leadership risk.
Management
Michael Kehoe is an unusual figure in the insurance industry. He is not a capital markets operator or a financial engineer. He is a career underwriter who spent fifteen years learning the E&S business at Colony Insurance and James River before founding Kinsale in 2009 with a simple thesis: build a technology platform that makes E&S underwriting faster and more accurate, keep the expense base lean, and never sacrifice underwriting quality for growth.
The thesis has compounded for fifteen years without deviation.
His 9.15% ownership stake (approximately 2.13 million shares) is worth approximately $700 million at current prices. When the combined ratio moves, Kehoe’s net worth moves with it. The alignment is structural, not contractual.
Kinsale’s management communication is notable for its restraint. The company does not provide earnings guidance. Kehoe’s commentary on market conditions is measured and technical, focused on underwriting trends rather than stock price. In the FY2025 earnings call, he described the E&S market as ‘steady but competitive’, set long-term GWP growth expectations at 10-20% over the cycle, and was direct about the soft market dynamics, without either dismissing the concerns or catastrophising them. This is the communication style of a manager who has been through cycles before.
The broader management team is deliberately lean. With fewer than 200 employees running a $1.98 billion premium book, the operational efficiency embedded in the technology platform is evident not just in the financials but in the headcount.
Valuation
At a share price of approximately $346 (mid-April 2026), Kinsale commands a market capitalisation of approximately $8.0 billion.
Multiples
What the multiple is pricing in
The relationship between price-to-book and ROE is the cleanest frame for insurance valuations. At 4.1x book, the market is implying that Kinsale will sustain ROE materially above its cost of equity for a long period. That is a reasonable expectation if premium growth recovers toward 15-20% and the combined ratio holds in the mid-70s. It is less comfortable if growth remains in single digits for two to three years.
Historical context: Kinsale traded at 20-25x earnings in its early post-IPO years (2016-2020) when the business was smaller. It peaked above 40x in 2022-2023 when the E&S hard market narrative was at full force. The current 16x represents a complete reversal of that premium on a far stronger balance sheet and earnings base.
Peer context: RLI Corp, a high-quality specialty insurer but with a less pronounced technology moat, typically trades at 20-24x. W.R. Berkley trades at 14-16x. Markel, often considered the quality benchmark of specialty insurance, trades at 18-22x. Kinsale at 16x sits at or below peers whose combined ratios and ROE figures are materially inferior. The de-rating has compressed the multiple below what its fundamental differentiation justifies.
Scenario analysis
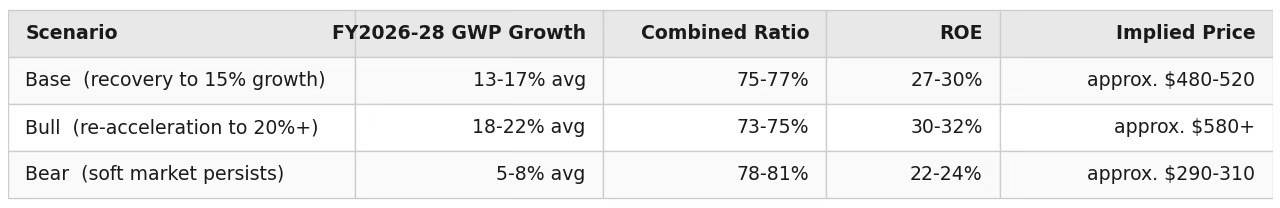
The base case implies 45-60% upside over three years from current prices. The bear case implies modest further downside. The asymmetry is reasonable from this entry point.
Bull vs Bear
Bull case
Kinsale is a structurally advantaged underwriter that has never had a bad underwriting year in fifteen years of operation. FY2025 is the worst GWP growth year Kinsale has reported in its public history, and the company still grew EPS 21.7%, improved the combined ratio, grew investment income 28%, and raised the dividend 47%. That is the moat operating under pressure. At 16x trailing earnings -- the cheapest the stock has been in three years -- that quality is available at a price that reflects the soft market, not the business.
Bear case
Kinsale has de-rated for reasons that are not transient. The E&S market is entering a soft cycle that could persist for two to three years. Premium growth will stay in single digits, catastrophe losses will create quarterly volatility, and the market will struggle to assign a premium multiple to a business whose growth has structurally slowed. 4.1x book for an insurer whose ROE has already declined from 32.3% to 29.3% as pricing normalises is still not obviously cheap. The correct analysis is that the stock was deeply expensive at $400 and is now fairly valued, not cheap.
Quality scorecard
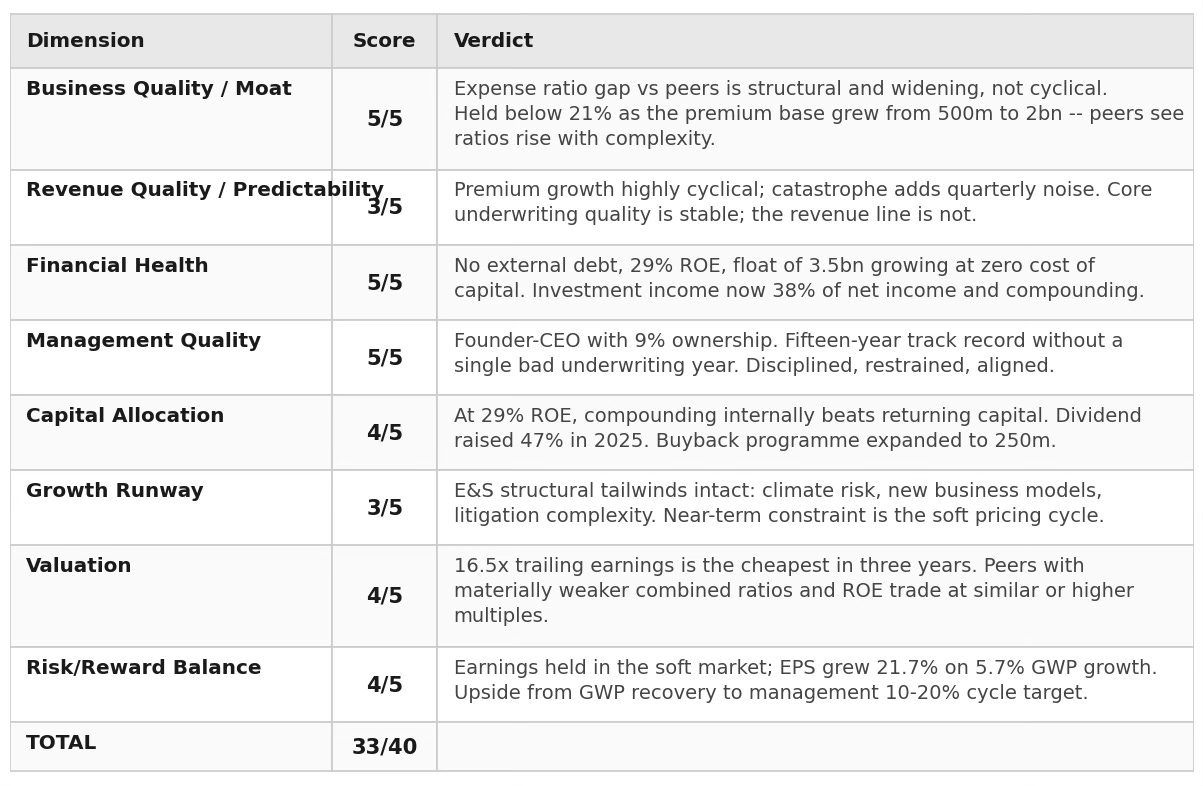
Our take
We would buy this stock at current prices. Not with the conviction of buying a business at a wide discount to intrinsic value -- Kinsale at 4x book is not that -- but with the conviction that comes from understanding what you are actually buying.
What you are buying is fifteen years of proof that Michael Kehoe can underwrite complex risks better and more cheaply than any competitor of scale in the United States. The combined ratio has never exceeded 84%. The expense ratio is a permanent structural advantage built on proprietary data and technology that cannot be replicated quickly. The float is $3.5 billion and growing. The balance sheet has almost no debt. The founder owns 9% of the company and has never once demonstrated that he values growth over underwriting quality.
The growth scare is now a full year of documented data, not a single quarter. FY2025 GWP grew 5.7%. That is real. But the earnings power of the business grew 21.7% anyway, because the float machine and the underwriting discipline did their job. The question is not whether the soft market is real; it is whether the business is still intact. The FY2025 numbers answer that clearly. It is.
Our specific view: this is a buy in the $330-360 range for investors with a three-year horizon. The base case is approximately 40-50% total return over three years as GWP growth recovers toward management’s 10-20% cycle target and the multiple normalises. Q1 2026 earnings on April 23 are the first hard data point on whether the recovery has begun.
Watch the combined ratio as the leading indicator. If it drifts toward 82-85% on a normalised (non-catastrophe) basis, the underwriting discipline story is changing and the multiple deserves to compress further. If it holds in the 75-78% range while growth recovers, this will look like an obvious buy in three years.
The insurance industry does not produce many businesses like this. When one de-rates from 40x to 16x on a growth scare, the right question is not whether the scare is real. It is whether the business is still intact. The FY2025 numbers answer that question clearly. It is.
The thesis in one sentence: Kinsale is a structurally advantaged underwriter temporarily priced like an average one, with a catalyst on April 23 that will either confirm the recovery is beginning or tell us how much longer patience is required. Either way, the price already reflects the disappointment. The business has not changed.
Kinsale Capital Group, Inc. reports in USD. All financial data sourced from Kinsale Capital Group SEC filings (10-K FY2025, Q4 2025 earnings press release (February 12, 2026)), earnings press releases, and investor relations materials. Share price data as at approximately mid-April 2026. This article is for informational purposes only and does not constitute investment advice.